A Case of Vidar Infostealer - Part 1 (Unpacking)
Hi, in this post, I’ll be unpacking and analyzing Vidar infostealer from my BSides Islamabad 2021 talk. Initial stage sample comes as .xll file which is Excel Add-in file extension. It allows third party applications to add extra functionality to Excel using Excel-DNA, a tool or library that is used to write .NET Excel add-ins. In this case, xll file embeds malicious downloader dll which further drops packed Vidar infostealer executable on victim machine, investigating whole infection chain is out of scope for this post, however I’ll be digging deep the dropped executable (Packed Vidar) in Part1 of this blogpost and final infostealer payload in Part2.
SHA256: 5cd0759c1e566b6e74ef3f29a49a34a08ded2dc44408fccd41b5a9845573a34c
Technical Analysis
I usually start unpacking general malware packers/loaders by looking it first into basic static analysis tools, then opening it into IDA and taking a bird’s eye view of different sections for variables with possible encrypted strings, keys, imports or other global variables containing important information, checking if it has any crypto signatures identified and then start debugging it. After loading it into x64dbg, I first put breakpoint on memory allocation APIs such as LocalAlloc, GlobalAlloc, VirtualAlloc and memory protection API: VirtualProtect, and hit run button to see if any of the breakpoints hits. If yes, then it is fairly simple to unpack it and extract next stage payload, otherwise it might require in-depth static and dynamic analysis. Let’s hit run button to see where it takes us next.
Shellcode Extraction
Here we go, the first breakpoint hits in this case, is VirtualProtect, being called on a stack memory region of size 0x28A to grant it Execute Read Write (0x40) protection, strange enough right!
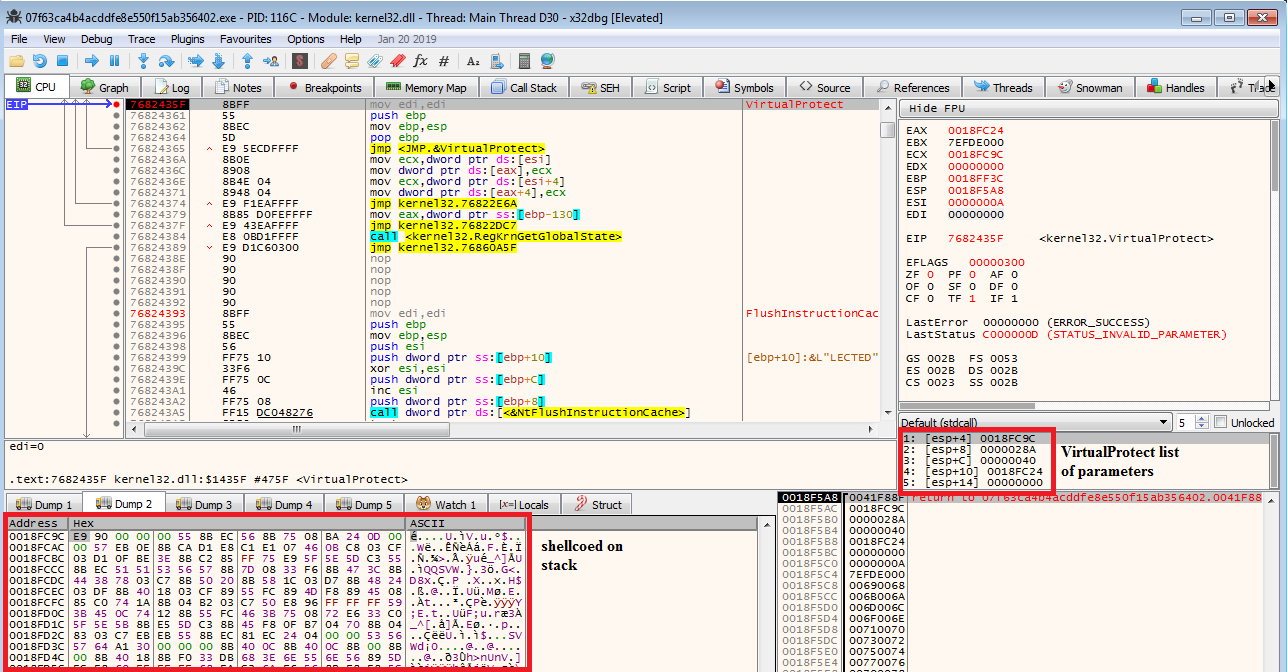 Figure1
first few opcodes E9, 55, 8B in dumped data on stack correspond to jmp, push and mov instructions respectively, so it can be assumed it is shellcode being pushed on stack and then granted Execute protection to later execute it, If I hit execute till return button on VirtualProtect and trace back from it into disassembler, I can see shellcode stored as stack strings right before VirtualProtect call and list of arguments are pushed as shown in the figure below
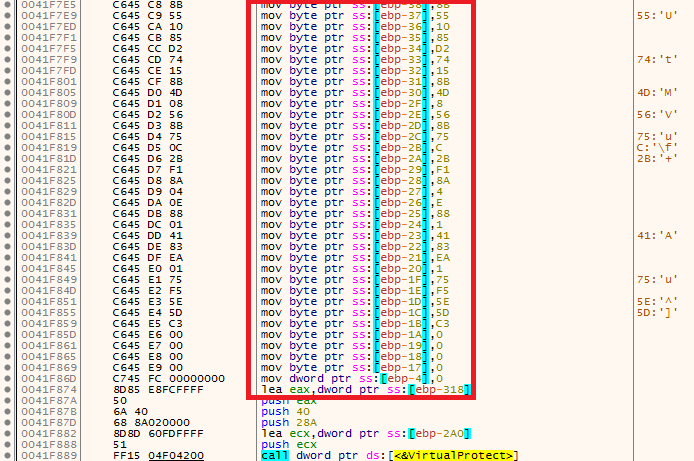
following few statements are preparing to execute shellcode on stack by retrieving a handle to a device context (DC) object and passing this handle to GrayStringA to execute shellcode from stack (ptr value in eax taken from Figure1)

let’s now start exploring the shellcode.
Debugging shellcode to extract final payload
As soon as, GrayStringA executes, it hits on VirtualAlloc breakpoint set in the debugger, which is being called to reserver/commit 0xAA3CE size of memory with MEM_COMMIT | MEM_RESERVE (0x3000) memory allocation type
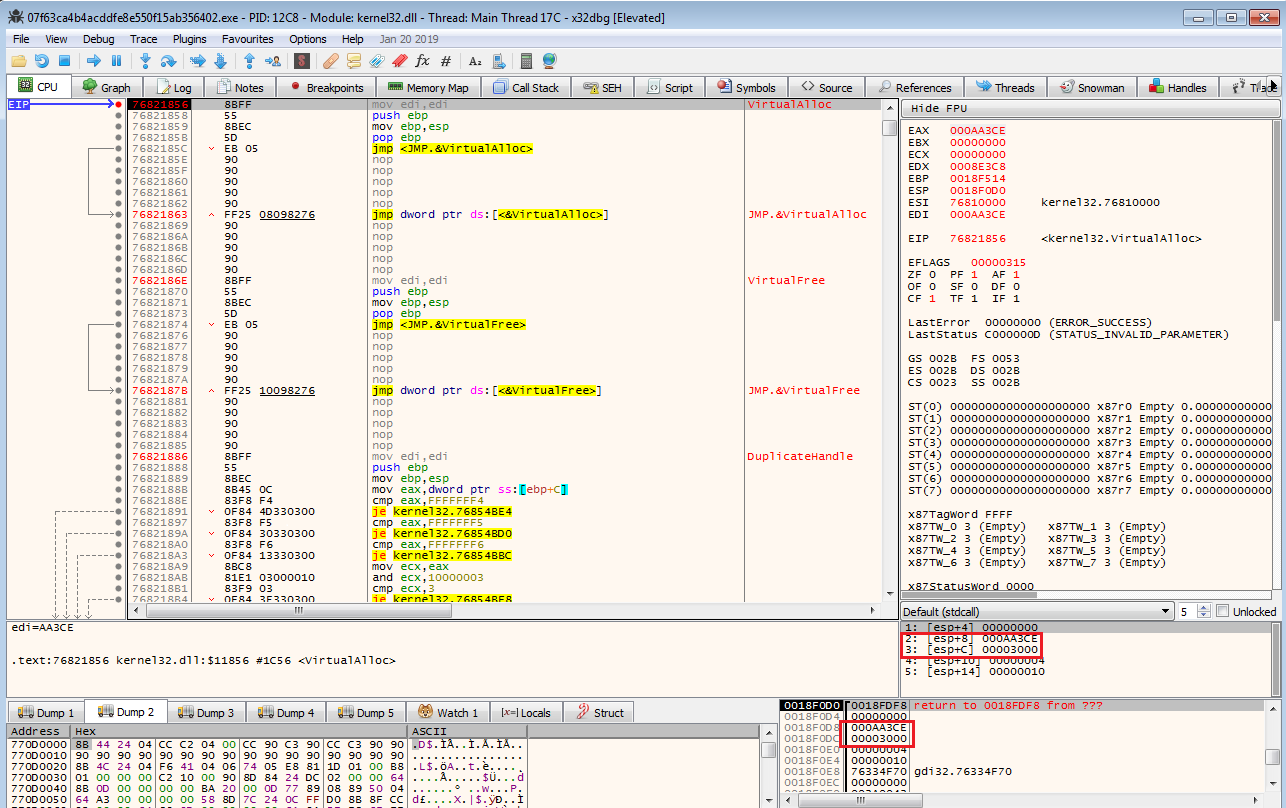
returning control from VirtualAlloc and stepping over one more time from ret, leads us to the shellcode, next few statements after VirtualAlloc call are pushing pointer to newly created buffer, size of the buffer and the file handle for currently loaded process on stack to call ReadFile
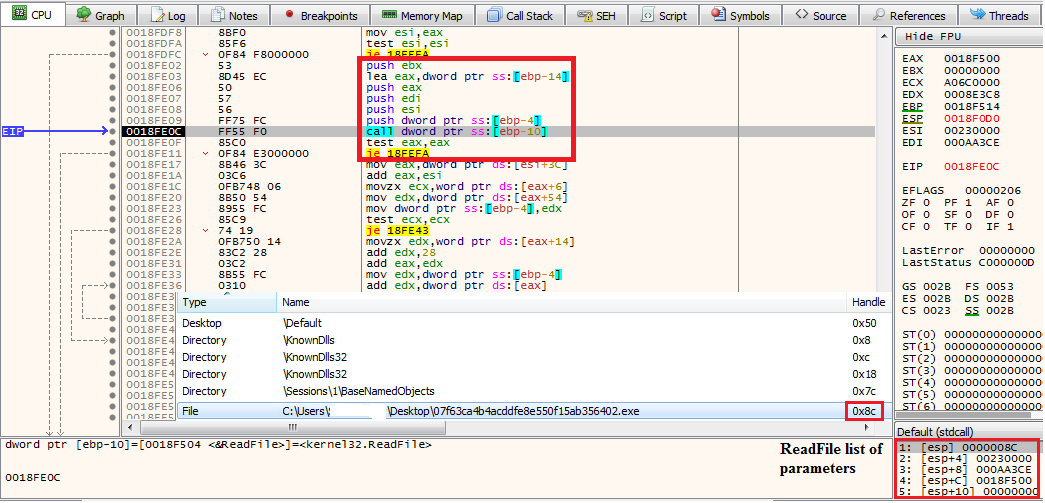
which reads 0xAA3CE bytes of data from parent process image into the buffer, let’s say it buffer1
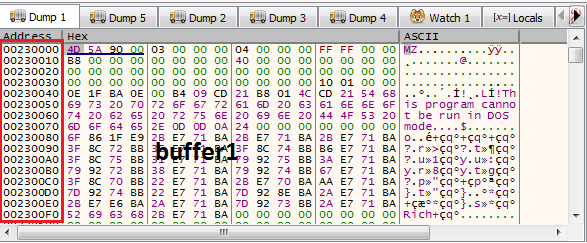
further execution again hits at VirtualAlloc breakpoint, this time allocating 0x14F0 bytes of memory, I’ll now put a write breakpoint in the memory region reserved/committed by second VirtualAlloc API call to see what and how data gets dumped into second buffer, buffer2. Hitting Run button once more will break at instruction shown in the figure below
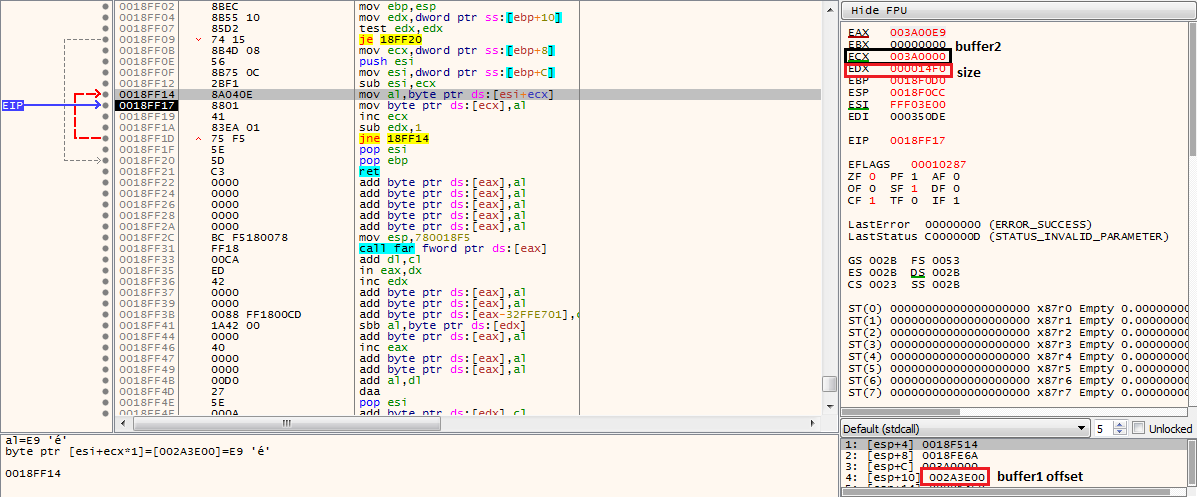
this loop is copying 0x14F0 bytes of data from a certain offset of buffer1 into buffer2, next few statements are agaian calling VirtualAlloc to allocate another 0x350DE bytes of memory say buffer3, pushing returned buffer address along with an offset from buffer1 on stack to copy 0x350DE bytes of data from buffer1 into buffer3
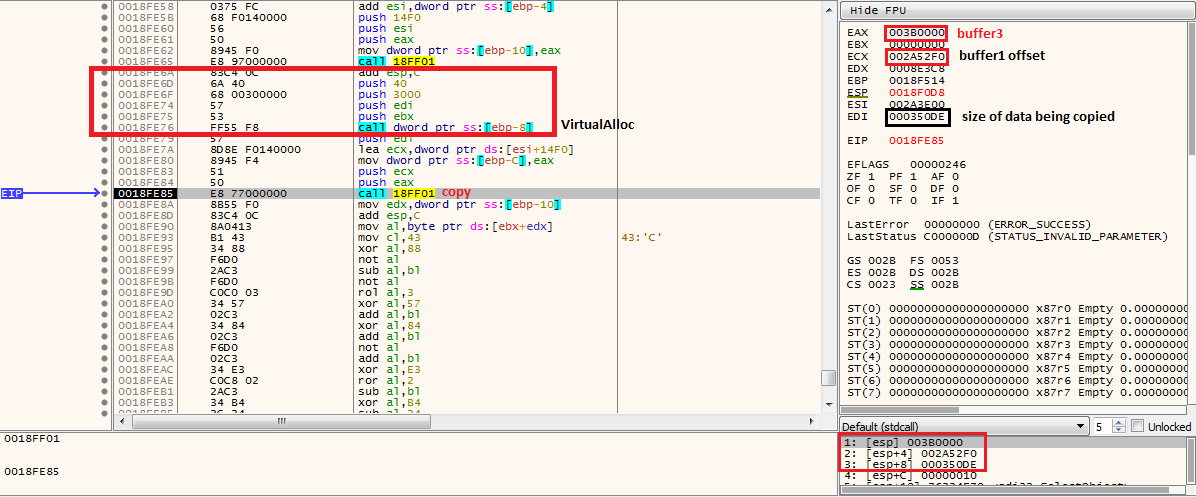
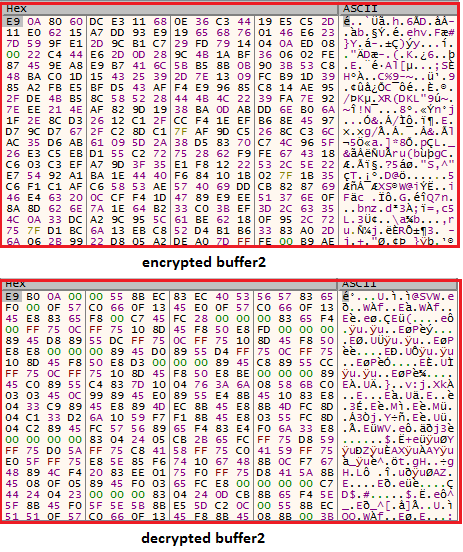
loop in the following figure is decrypting data copied to buffer2, next push instruction is pushing the buffer3 pointer on stack as an argument of the routine being called from buffer2 address in edx which is supposed to process buffer3 contents
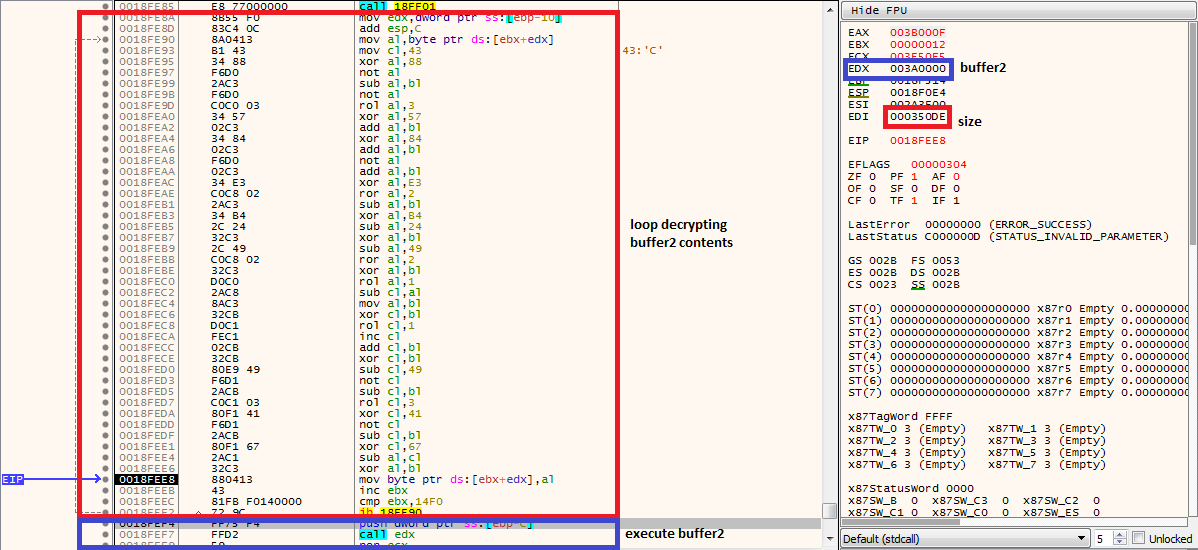
figure below is showing final buffer2 decrypted contents
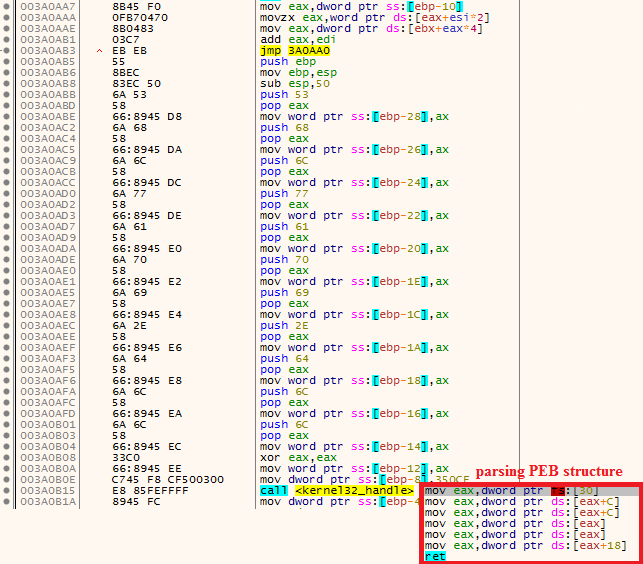
stepping into edx starts executing buffer2 contents, where it seems to push stack strings for kernel32.dll first and then retrieves kernel32.dll handle by parsing PEB (Process Environment Block) structure
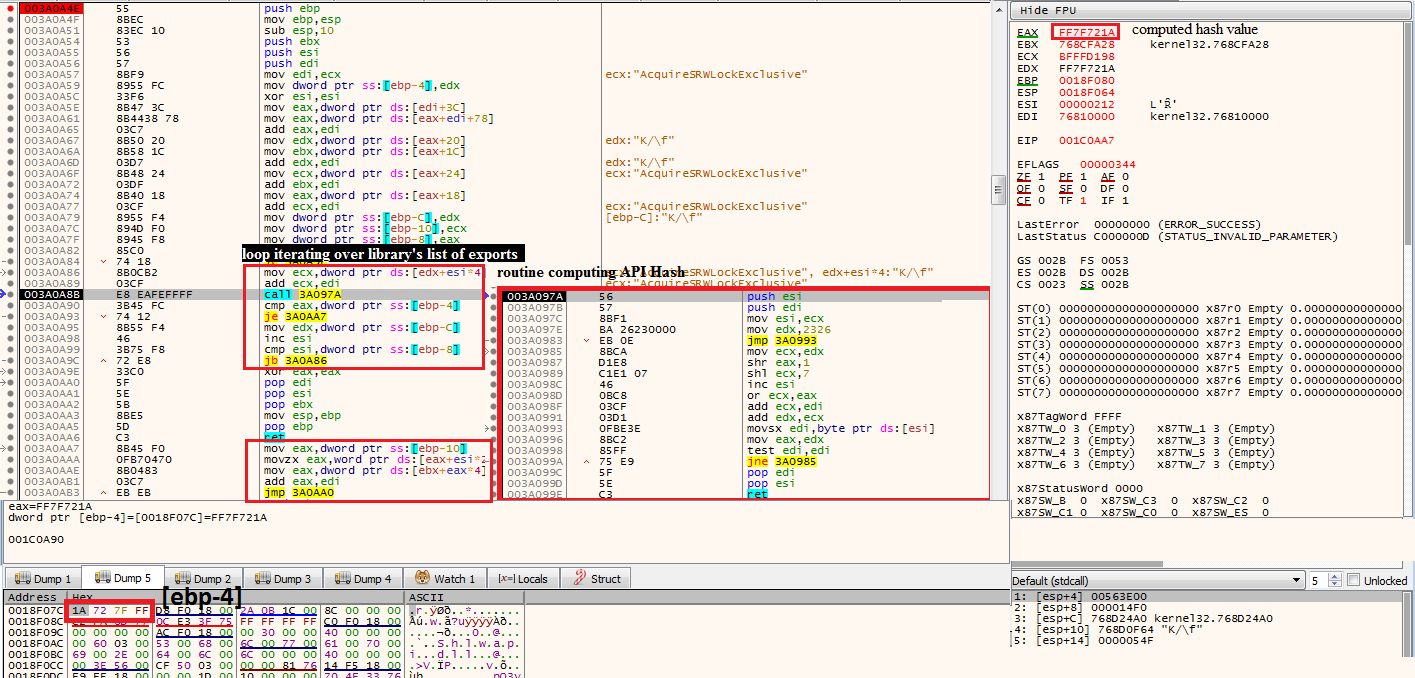
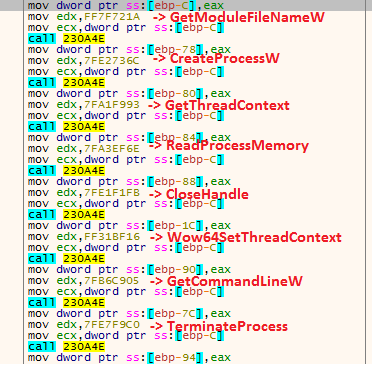
retrieved kernel32.dll handle is passed to next call along with another argument with constant FF7F721A value, a quick Google search for this constant results in some public sandbox links but not clear what is this exactly about. Let’s dig into it further, stepping over this routine 0x0A4E results in GetModuleFileNameW API’s resolved address from Kernel32.dll stored in eax which means this routine is meant to resolve hashed APIs

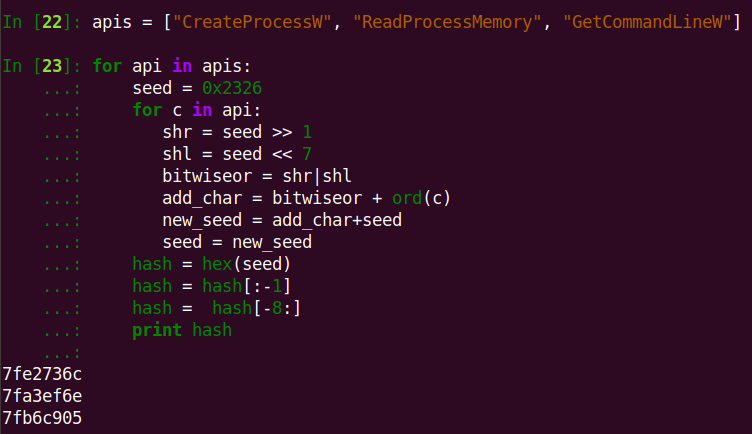
similarly second call resolves 7F91A078 hash value to ExitProcess API, wrapper routine 0x0A4E iterates over library exports and routine 0x097A is computing hash against input export name parameter. Shellcode seems to be using a custom algorithm to hash API, computed hash value is retuned back into eax which is compared to the input hash value stored at [ebp-4], if both hash values are equal, API is resolved and its address is stored in eax
next few instructions write some junk data on stack followed by pushing pointer to buffer3 and total size of buffer3 contents (0x350C0) on stack and execute routine 0x0BE9 for decryption - this custom decryption scheme works by processing each byte from buffer3 using repetitive neg, sub, add, sar, shl, not, or and xor set of instructions with hard-coded values in multiple layers, intermediate result is stored in [ebp-1]
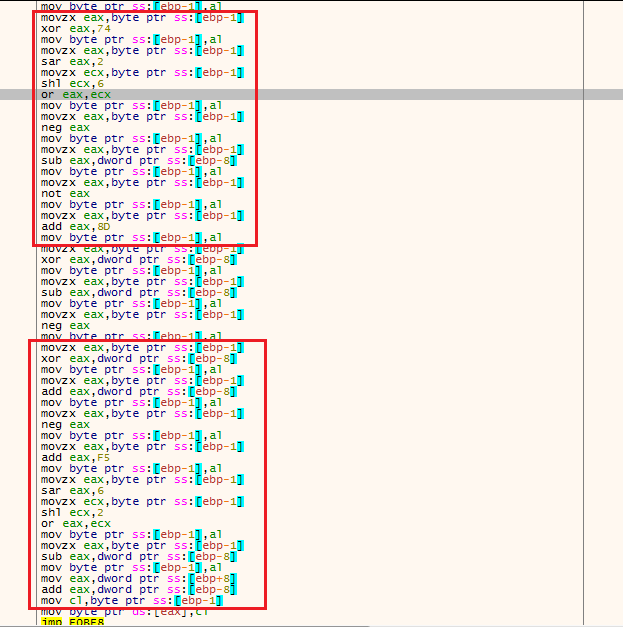
and final value overwrites the corresponding buffer3 value at [eax] offset
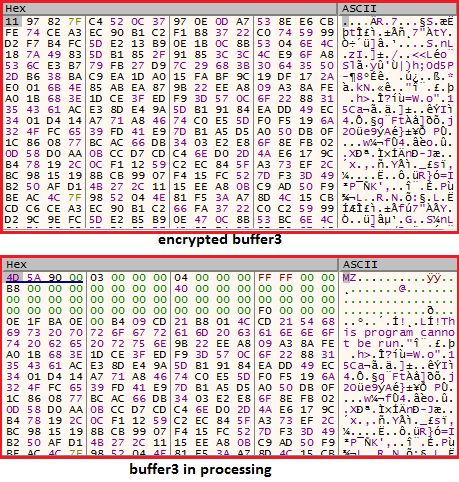
once buffer3 contents are decrypted, it continues to resolve other important APIs in next routine 0x0FB6
I wrote a simple POC python script for hashing algorithm implemented by decrypted shellcode which can be found here
after all required APIs have been resolved, it proceeds to create a new process
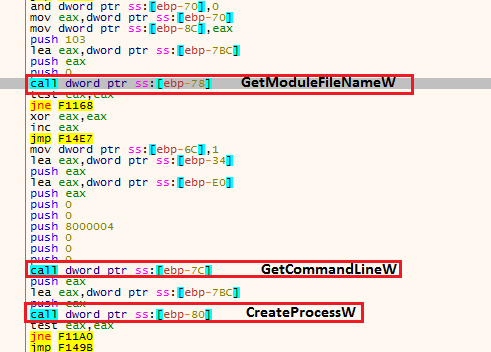
using CreateProcessW in suspended mode

and then final payload is injected into newly created process using SetThreadContext API, CONTEXT structure for remote thread is set up with ContextFlag and required memory buffers and SetThreadContext API is called with current thread handle and remote thread CONTEXT structure for code injection
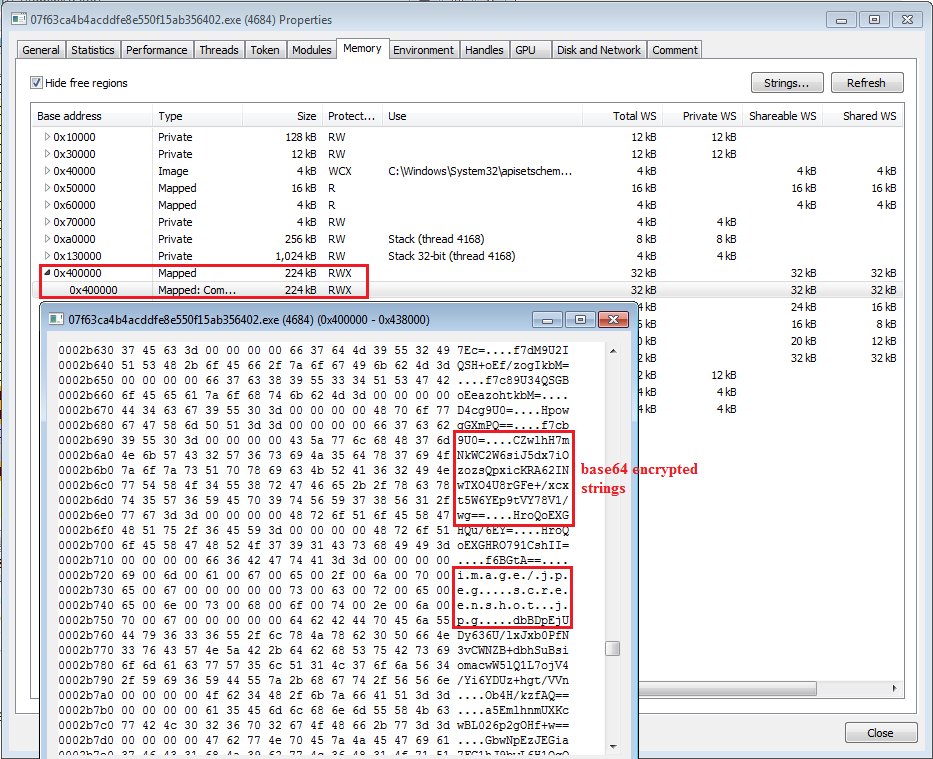
main process terminates right after launching this process, we can now take a dump of this process to extract final payload.
That’s it for unpacking! see you soon in the next blogpost covering detailed analysis of Vidar infostealer.